 ReddRadar
research data visualization software - AI tools
-
 Exploring Data Interactive Data Visualizations with Open Data and Open Source Tools
Exploring Data is a platform showcasing interactive data visualizations created using open data and open source tools, featuring various network graphs, 3D globes, and geographic maps.
- Free
-
 Avanzai Talk Data, See Charts
Avanzai is an AI-powered data visualization platform that transforms complex market analysis into interactive charts through natural language processing, supporting both built-in financial data and custom datasets.
- Contact for Pricing
-
 Datacopia Effortless Data Visualization for Everyone
Datacopia enables users to effortlessly generate a wide variety of charts and graphs from their data, streamlining data analysis and visualization tasks.
- Other
-
 Visual.is Create beautiful and dynamic data visualizations easily
Visual.is is an AI-powered platform that enables users to create professional reports, charts, and dashboards without technical expertise, offering user-friendly tools with beautiful design templates.
- Freemium
- From 8$
-
 Insiderviz AI-powered data visualization platform
Insiderviz is an AI tool for creating interactive data visualizations and insights from complex datasets.
- Other
-
 clarafinds.com Visualize Datasets and Find Financial Products
Clara transforms spreadsheets into interactive visualizations for better understanding and collaboration. It also serves as a database to find and compare financial products.
- Contact for Pricing
-
 haystack.design Unlimited Custom Data Visualizations on Demand
Haystack offers a subscription-based service for unlimited custom data visualizations, including charts, graphs, maps, and infographics, tailored to your specific needs. Streamline your data storytelling with rapid turnaround, expert design, and unlimited revisions.
- Paid
- From 2995$
-
 welcome.calcgen.ai Build Beautiful, Interactive, Customizable Data Visuals in Seconds
CalcGen uses a swarm of AI agents to automatically research, analyze, and create interactive, customizable data visualizations from a single prompt.
- Paid
- From 10$
-
 Litmaps Discover and visualize scientific literature faster
Litmaps is a literature review software that helps researchers, students, and professionals discover, visualize, and share academic papers across 150 countries, making research workflows more efficient.
- Freemium
- From 10$
-
 Instadeq No-code Data Analysis & Interactive Visualizations
Instadeq is a no-code platform enabling users to transform various data sources like spreadsheets and APIs into interactive, always up-to-date dashboards.
- Contact for Pricing
-
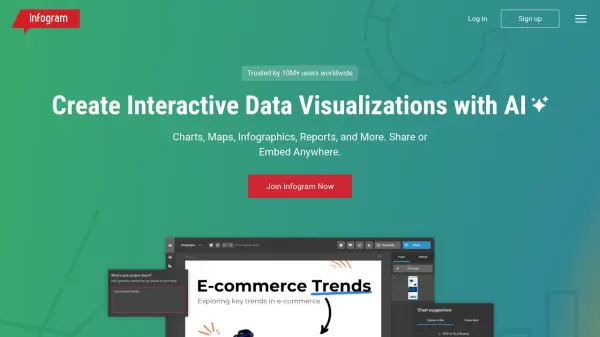 Infogram Create Interactive Data Visualizations with AI
Infogram is a data visualization platform that allows users to create interactive charts, maps, infographics, reports, and more. Leverage AI to enhance your workflow and share or embed your creations anywhere.
- Freemium
- From 19$
-
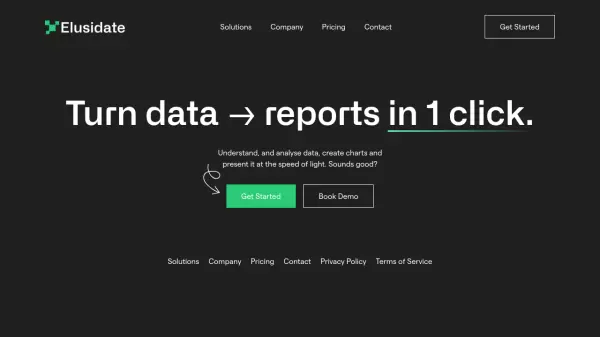 Elusidate Turn data into reports in 1 click
Elusidate is an AI-powered data analysis and visualization tool that transforms raw data into comprehensive reports, charts, and presentations instantly.
- Freemium
- From 4$
-
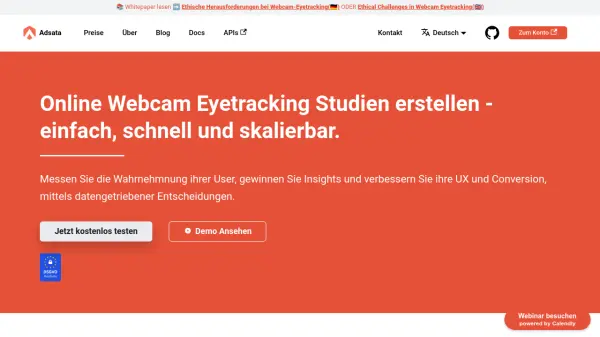 Adsata Online Webcam Eyetracking Studies - Simple, Fast, Scalable.
Adsata offers online webcam eye-tracking studies to measure user perception, improve UX and conversions, and gain data-driven insights. Understand user behavior through heatmaps, path plots, and metrics.
- Freemium
- From 160$
-
 InstaCharts Instant Data Visualization and Smart Chart Creation
InstaCharts is an intuitive data visualization tool that uses smart technology to automatically generate interactive charts and tables from your spreadsheet data. Easily create, customize, share, and embed compelling visualizations for reports, websites, and data exploration.
- Freemium
- From 10$
-
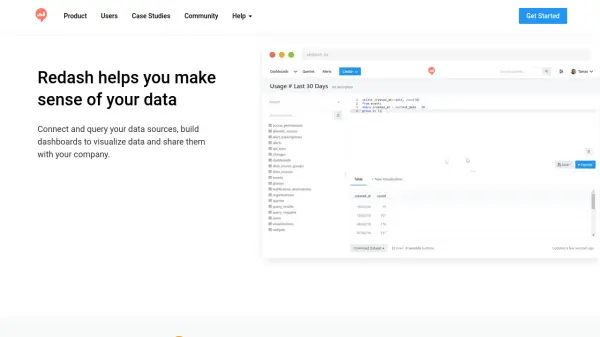 Redash Collaborative Data Visualization and Query Platform
Redash empowers users to connect, query, and visualize data from multiple sources, enabling informed decision-making through shareable dashboards.
- Other
-
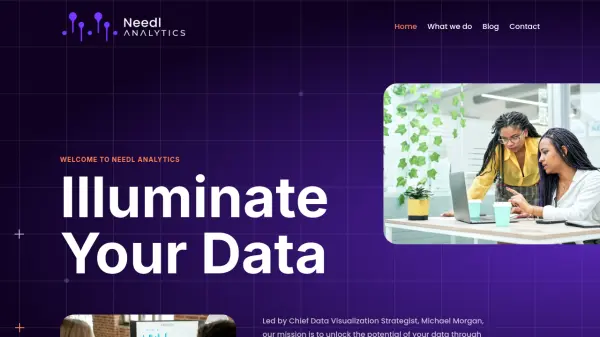 Needl Analytics Empowering Data-Driven Decision-Making with Advanced Visualization
Needl Analytics provides specialized data visualization and business intelligence consulting, training, and solution development to help professionals make informed, strategic decisions.
- Contact for Pricing
-
 DataLion Dashboard-Software für die Marktforschung
DataLion is a leading provider of dashboard software and data consultancy for market research and business intelligence, offering features like SPSS file import, weighting, and complex calculations.
- Contact for Pricing
-
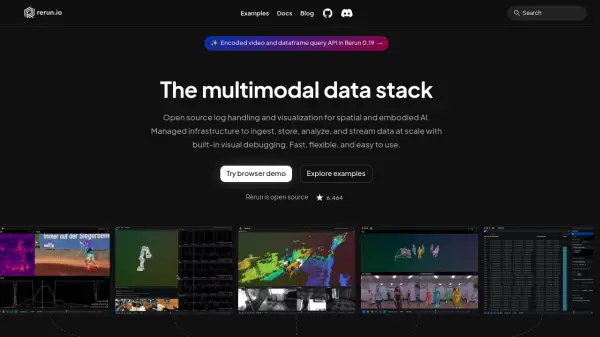 Rerun The multimodal data stack for spatial and embodied AI visualization
Rerun is an open-source platform offering log handling and visualization tools for spatial and embodied AI, featuring fast multimodal data visualization and powerful query capabilities for robotics and AI applications.
- Freemium
-
 xyzt.ai Turn your IoT data into actionable insights
xyzt.ai is a powerful platform that combines spatial and time series analysis to visualize and analyze spatio-temporal data from any source, regardless of size. It specializes in IoT, maritime, and mobility data analytics with GenAI-powered insights.
- Contact for Pricing
-
 Cnidarity Specialized Content Management for Academic Research
Cnidarity is an AI-powered platform that helps researchers organize, visualize, and collaborate on research data across disciplines with custom content models and interactive dashboards.
- Freemium
- From 5$
-
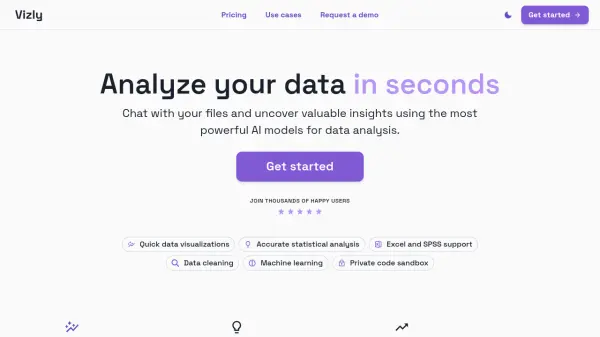 getvizly.com Analyze your data in seconds
Vizly is an AI-powered data analysis tool that allows users to chat with their files, uncover insights, and generate visualizations.
- Freemium
- From 20$
-
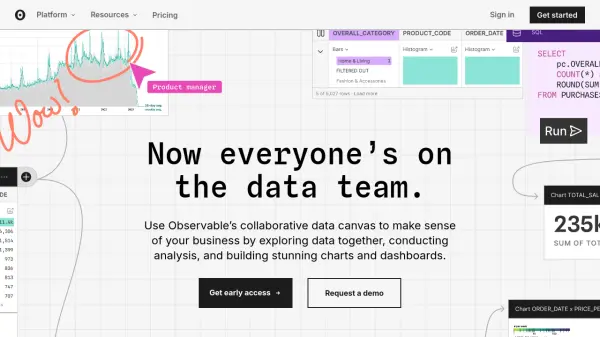 Observable Collaborative Data Canvas for Analysis and Visualization
Observable offers a collaborative platform for teams to explore, analyze, and visualize data together with real-time AI-assisted features and interactive dashboards.
- Paid
- From 900$
-
 emergence.com.sg Automated Data Insights and Interactive Visual Analytics
Sprucely.io delivers automated visual data analytics, transforming data from multiple sources into interactive dashboards for enhanced decision intelligence.
- Other
-
 ChartPixel Automated charts and insights in 30 seconds
ChartPixel is an AI-powered data analysis platform that transforms complex data into clear visualizations and actionable insights without coding. It offers automated data cleaning, statistical analysis, and instant chart generation suitable for both beginners and professionals.
- Freemium
- From 15$
Featured Tools
Join Our Newsletter
Stay updated with the latest AI tools, news, and offers by subscribing to our weekly newsletter.
Explore More
-
sales pipeline coaching software 55 tools
-
AI background remover API 27 tools
-
WordPress site management AI 39 tools
-
AI podcast preparation 42 tools
-
collaborative learning quiz tool 39 tools
-
smart gift suggestion app 29 tools
-
affordable SEO analysis tool 35 tools
-
AI math calculator 9 tools
-
AI grammar checker for websites 17 tools
Didn't find tool you were looking for?